DripTech Eco-Flow | Irrigation equipment in Kenya
How to Read Irrigation Pump Performance Curves Accurately
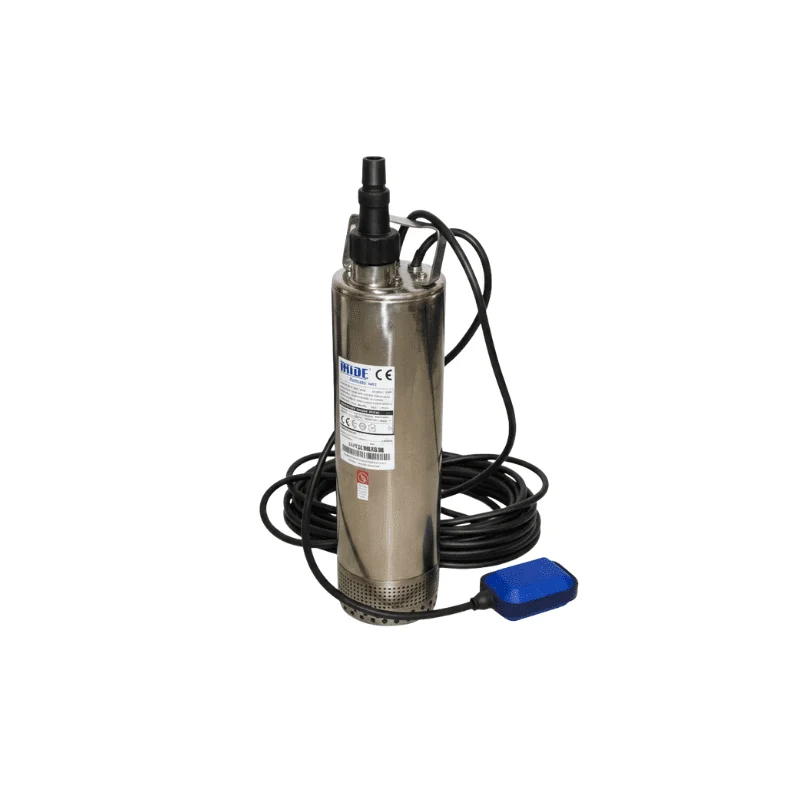
Two 2 HP irrigation pumps can perform completely differently on the same borehole or river. Reading the Q-H performance curve against your farm's Total Dynamic Head (TDH) system resistance curve prevents dead-heading, impeller recirculation, suction cavitation, and premature motor burnout.
Why Accurate Pump Curve Reading Matters for Staff and Farmers
Selecting an irrigation pump by horsepower or catalog maximum head/flow alone is the single most common sizing mistake on Kenyan farms. A datasheet headline such as 100 m max head and 8 m3/h max flow represents two opposite corners of the chart that never happen simultaneously: at 100 m head the flow is zero, and at 8 m3/h the head is zero.
Your real operating delivery happens exclusively at one point: where the pump's falling Q-H curve crosses your farm's rising System Resistance Curve. Verifying this intersection keeps electrical efficiency high, motor windings cool, and emitter or sprinkler pressure uniform across every zone.
The 5 Core Elements on Every Pump Performance Chart
Manufacturer curves from Grundfos, Franklin Electric, Pedrollo, Dayliff, and Lorentz share the same layout: Flow Q (m3/h or L/min) runs along the horizontal X-axis and Total Dynamic Head H (meters) runs up the vertical Y-axis.
| Curve Feature | Where on Graph | Engineering Meaning & Field Impact |
|---|---|---|
| Shutoff Head (Q = 0) | Top-left Y-axis intercept | Maximum vertical pressure when discharge valve is closed. Never run continuously here: hydraulic energy turns into heat inside the casing within minutes. |
| Pump Q-H Curve | Blue/primary downward slope | Shows how flow increases as Total Dynamic Head drops. Multistage borehole pumps have steep curves; surface centrifugal transfer pumps have flatter curves. |
| System Resistance Curve | Amber/upward parabola from static head | Starts on Y-axis at fixed Static Lift + Working Pressure, then curves up with Hazen-Williams pipe friction proportional to Q^1.852. |
| Duty / Operating Point | Exact intersection of Pump & System curves | True field flow and head delivered when you open irrigation valves—often different from brochure headline ratings. |
| BEP (Best Efficiency Point) | Peak of efficiency contour on curve | Flow where hydraulic efficiency peaks, radial shaft loads balance near zero, and thrust bearings last longest. |
70% to 120% BEP Preferred Operating Range (POR) vs Danger Zones
Hydraulic engineering standards (ANSI/HI 9.6.3 and major submersible OEM manuals) define the Preferred Operating Range (POR) between 70% and 120% of Best Efficiency Point (BEP) flow. Operating far outside this window rapidly degrades seals, bearings, and windings even if the motor thermal overload never trips immediately.
| Operating Zone | Flow vs BEP | Physical Symptoms & Component Risk |
|---|---|---|
| Recirculation Zone (Too Throttled / Oversized Pump) | Below 70% of BEP | Discharge and suction recirculation inside impeller eye causes heavy shaft deflection, mechanical seal weeping, bearing wear, and overheating. |
| Preferred Operating Range (POR) | 70% to 120% of BEP | Optimal Zone: Smooth laminar impeller exit, minimal vibration, lowest specific energy (kWh/m3), and longest motor/wet-end service life. |
| Runout Zone (Low-Head Open Discharge) | Above 120% of BEP | Extreme velocity drops NPSH margin causing suction cavitation, heavy down-thrust bearing wear, and motor amp draw exceeding nameplate. |
How Solar VFD Speed (Hz) Shifts the Pump Curve
Solar pumps driven by an MPPT variable-frequency drive slow down during clouds, early morning, and late afternoon. Under pump Affinity Laws, flow scales linearly with speed (Q2 = Q1 * N2/N1) while head scales with speed squared (H2 = H1 * (N2/N1)^2).
Dropping from 50 Hz to 40 Hz cuts maximum flow to 80%, but slashes shutoff head down to 64% (0.8 squared). If morning shutoff head falls below the farm's fixed Static Lift + Pressure threshold, the motor spins without lifting a single drop of water—making minimum cut-off frequency tuning critical for solar borehole longevity.
- Test full-sun 50 Hz AND cloudy 40–42 Hz intersections before buying a solar borehole pump
- Program the VFD minimum frequency limit (typically 28–35 Hz depending on static lift) to prevent stagnant zero-flow water churning
- Use an elevated storage tank with gravity-fed drip blocks whenever solar afternoon irradiance surges past direct block demand
4-Step Staff Checklist Using the 3-Point Datasheet Mode
- Step 1: Read 3 points from the manufacturer curve — Shutoff Head at 0 m3/h, BEP flow/head, and far-right Runout point
- Step 2: Calculate true farm TDH (Static + Drawdown + Elevation + Working Drip/Sprinkler Pressure + Hazen-Williams Pipe Loss)
- Step 3: Plot both curves using DripTech's 3-Point Datasheet Calibration tool above and check that Duty Flow sits between 70% and 120% BEP
- Step 4: Verify suction lift stays below Kenya's highland altitude cavitation ceiling (~5.5–6.0 m) on all surface centrifugal pumps
Frequently asked questions
Why does my pump deliver much less water than the maximum m3/h printed on the nameplate?
The nameplate Qmax applies only at zero vertical lift and zero pipe resistance. Actual flow on the farm is determined where the falling pump curve intersects your rising System Resistance Curve (static lift + drawdown + emitter pressure + pipe friction).
What happens if I partially close a gate valve to reduce pump flow below 70% BEP?
Throttling increases system resistance and slides the operating point left toward shutoff. Below 70% BEP, turbulent fluid recirculates inside the impeller vanes, increasing radial shaft deflection, vibration, and winding heat. Instead, match a smaller pump stage count or trim VFD speed.
How accurate is a 3-point curve fit compared to a 2-point Qmax/Hmax fit?
A 2-point parabolic fit estimates typical submersible curvature when only Qmax and Hmax are available. Entering 3 coordinates from the manufacturer's curve (Shutoff Head, BEP Flow/Head, and Runout Point) reproduces the OEM curve shape accurately across the full working band.
Products you can use for this
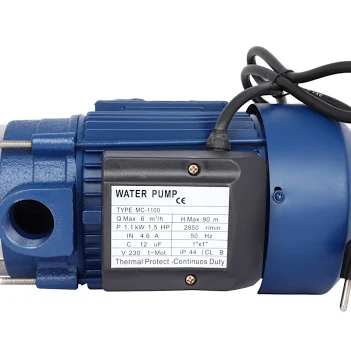 0.5 HP Solar Submersible Borehole PumpKSh 17,000
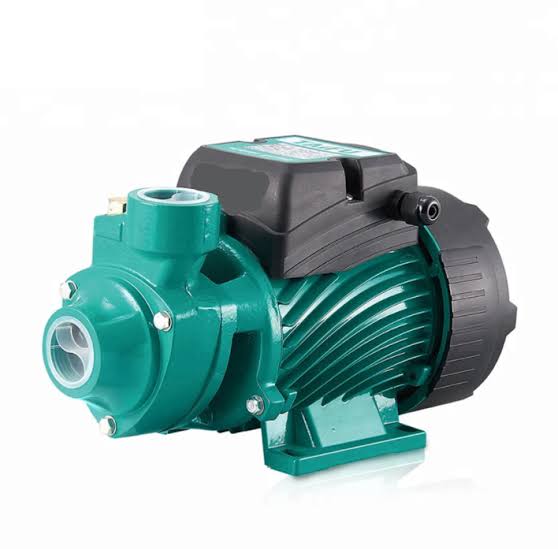 0.75 HP Electric Booster Pump (Single-Stage)KSh 14,000
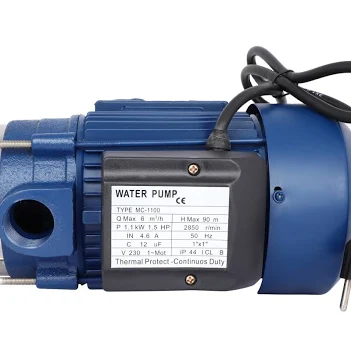 1.5 HP Electric Booster Pump (Multi-Stage)KSh 36,000
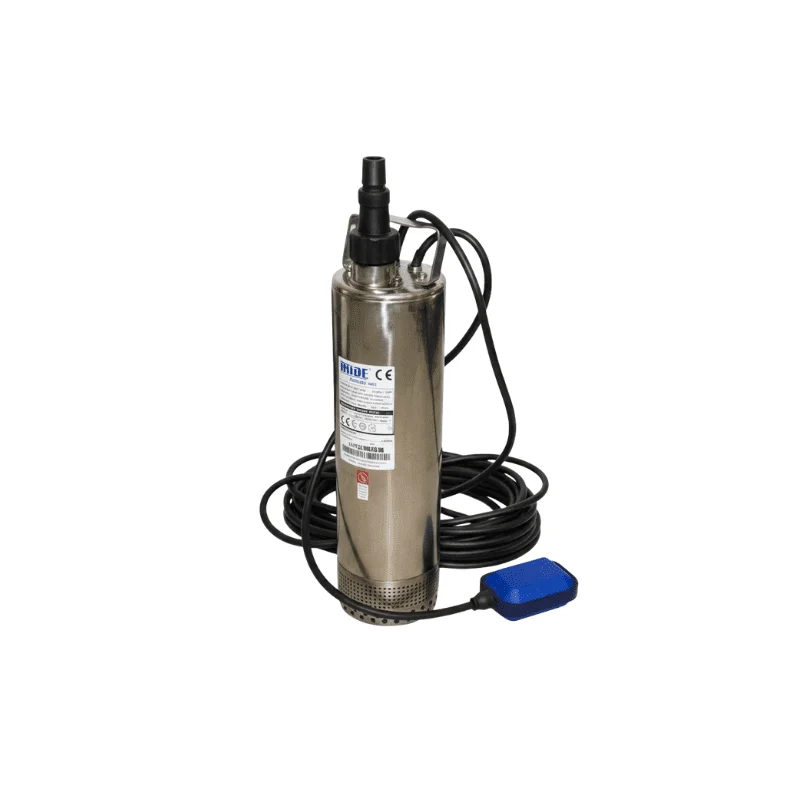 1.5 HP Electric Booster Pump (Single-Stage)KSh 23,000
Browse all irrigation products or ask DripTech to size a system for your farm.